US Household Income EDA Project
- Jun 14, 2025
- 1 min read
In this project I walk through the process of exploring the now cleaned data and finding potential insights.
🎯 Purpose
Uncovered regional income and land distribution trends in the U.S. using SQL aggregations and joins.
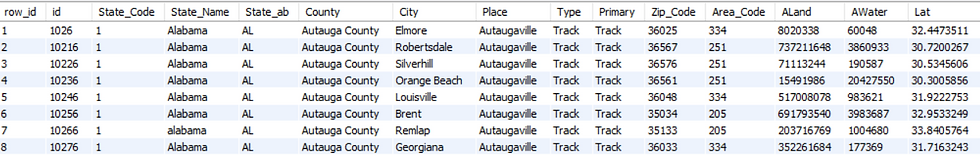
Let's take a look at the data
🛠️ Key Insights via Code
✅ Top 10 Largest States by Land Area
SELECT State_Name, SUM(ALand), SUM(AWater)
FROM us_project.us_household_income
Group By State_name
Order By 2 DESC
Limit 10;
✅ Average Household Income by State
SELECT u.State_Name, ROUND(AVG(Mean),1), ROUND(AVG(Median),1)
FROM us_project.us_household_income u
INNER JOIN us_project.us_household_income_statistics us
	ON u.id = us.id
WHERE Mean <> 0
Group By u.State_Name
Order By 2 DESC
LIMIT 10;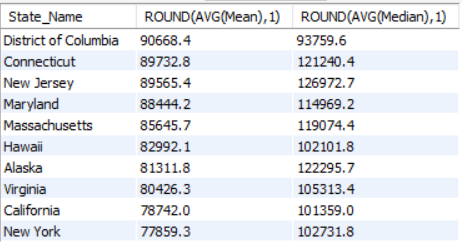
✅ Income Distribution by Area Type
SELECT Type, COUNT(Type), ROUND(AVG(Mean),1), ROUND(AVG(Median),1)
FROM us_project.us_household_income u
INNER JOIN us_project.us_household_income_statistics us
	ON u.id = us.id
WHERE Mean <> 0
Group By 1
HAVING COUNT(TYPE) > 100
Order By 4 DESC
LIMIT 20;
This shows the types of areas that typically have the highest income on average in the US.
💡 Impact
Revealed disparities in income by geography and helped identify high-earning regions and area types.


Comments